Interesting meeting and discussion with Prof. Wong Pho Kam, head of the NUS Enterprise Center (NEC), on business model design, dealing with the following questions:
[Financing] The financing and funding could influence the design of business models. Even if he has no definitive asnwer, Poh Kam was asking if we could extend the BMGEN canvas with a (10th) block entitled “Financing”? We already had this discussion with Alex and during workshops. So far, we were not convincing and we have seen few solid arguments for including this aspect in the canvas.
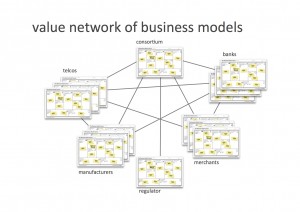
[Stakeholders] Representing the different stakeholders concerned by a business model and the flows between them has been suggested by some actors – Board of Innovation (web), for example. Poh Kam finds this representation could be a nice complement to the BMGEN canvas. With Alex and Boris, we already decided to address this issue, but in a more general way. So far, we have considered ONE business model at a time. It is one of our goal in the next couple of months to investigate how to represent and visualize MULTIPLE business models (portfolio of business models, value network or ecosystem of business models, triple bottom line business model, …)
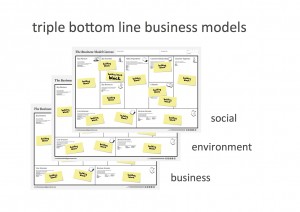
[Social business] Related to the last term, the question concerns the representation and visualization of different aspects of a business, specially a social business. It should be interesting to isolate the pure business side from the social or environmental ones. The revenue building block is meaningful in the first one, but much less in the second ones, where the revenue is not money but could be social value. In our vision with Alex, we have the impression that we could deal with this issue in a visual way by using different layers on top of each other. We already had some experiments along this way with Boris
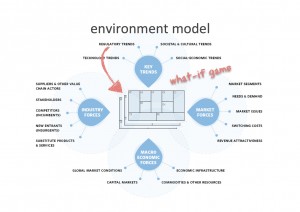
[Compliance] Poh Kam observed that in some situations, regulation has a strong influence on some components of a business model. Sometimes this influence or pressure is different from one country to another. He was asking if we can represent this kind of constraint in a more specific way. A partial answer is in our environment model, since we have explicitly defined regulation as a component of this model. However the influence relationship, showing a pressure link between a regulation item and the component which are influenced or has to be compliant to this regulation is not drawn (by an arrow, for example) on the canvas. In a general manner, the links between the environment issues and the business model components have not been visualized so far.
and the most challenging issue …
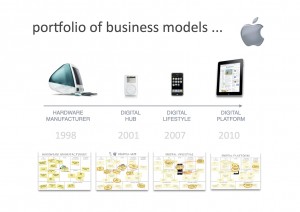
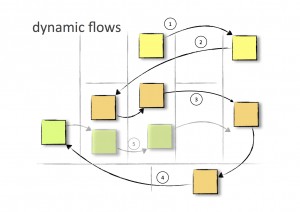
[Dynamics] The question here is how to represent the evolution of a business model, the flows between its components, and what we could consider as an “accumulation” process. How to represent and visualize the following situation: a value proposition attracts more and more customers. These customers generates more and more data (on their behavior). Those data eventually become a key resource for the company, which decides to add a new value proposition for another segment (advertisers) with an additional revenue stream, and transforms its business model in a double sided platform. This new revenue allows to buy another resource, or to acquire another partner, for doing something better or different, etc. With the canvas, we can represent the different models, at different times in the history, as we did for the Apple case, as snapshot along the time line, but not the dynamics, the movie, between the models and the flows between components. Long time ago, we already discussed this kind of phenomenon with Alex; we brainstormed on simulation, systems dynamics and serious gaming but never took time to carefully examine this issue. Nice challenge for research.













 (
(


